sexta-feira, 29 de junho de 2012

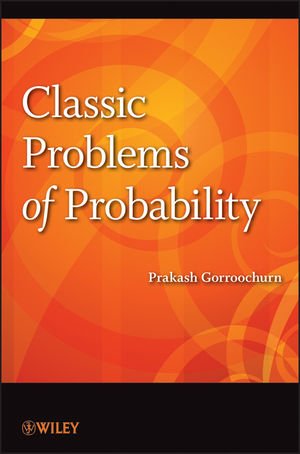
Classic Problems of Probability


Prakash Gorroochurn

Wiley | 2012 | 320 páginas | PDF | 6,5 Mb


link
uploading.com

"A great book, one that I will certainly add to my personal library."
--Paul J. Nahin, Professor Emeritus of Electrical Engineering, University of New Hampshire

Classic Problems of Probability presents a lively account of the most intriguing aspects of statistics. The book features a large collection of more than thirty classic probability problems which have been carefully selected for their interesting history, the way they have shaped the field, and their counterintuitive nature.

From Cardano's 1564 Games of Chance to Jacob Bernoulli's 1713 Golden Theorem to Parrondo's 1996 Perplexing Paradox, the book clearly outlines the puzzles and problems of probability, interweaving the discussion with rich historical detail and the story of how the mathematicians involved arrived at their solutions. Each problem is given an in-depth treatment, including detailed and rigorous mathematical proofs as needed. Some of the fascinating topics discussed by the author include:
  • Buffon's Needle problem and its ingenious treatment by Joseph Barbier, culminating into a discussion of invariance
  • Various paradoxes raised by Joseph Bertrand
  • Classic problems in decision theory, including Pascal's Wager, Kraitchik's Neckties, and Newcomb's problem
  • The Bayesian paradigm and various philosophies of probability
  • Coverage of both elementary and more complex problems, including the Chevalier de Méré problems, Fisher and the lady testing tea, the birthday problem and its various extensions, and the Borel-Kolmogorov paradox
Classic Problems of Probability is an eye-opening, one-of-a-kind reference for researchers and professionals interested in the history of probability and the varied problem-solving strategies employed throughout the ages. The book also serves as an insightful supplement for courses on mathematical probability and introductory probability and statistics at the undergraduate level.

Preface 3
Problem 1. Cardano and Games of Chance (1564) 8
Problem 2. Gailieo and a Discovery Concerning Dice (1620) 15
Problem 3. The Chevalier de Méré Problem I: The Problem of Dice (1654) 17
Problem 4. The Chevalier de Méré Problem II: The Problem of Points (1654) 22
Problem 5. Huygens and the Gambler’s Ruin (1657) 39
Problem 6. The Pepys-Newton Connection (1693) 47
Problem 7. Rencontres with Montmort (1708) 50
Problem 8. Jacob Bernoulli and his Golden Theorem (1713) 54
Problem 9. De Moivre’s Problem (1730) 71
Problem 10. De Moivre, Gauss, and the Normal Curve (1730, 1809) 79
Problem 11. Daniel Bernoulli and the St Petersburg Problem (1738) 94
Problem 12. D’Alembert and the “Croix ou Pile” Article (1754) 102
Problem 13. D’Alembert and the Gambler’s Fallacy (1761) 105
Problem 14. Bayes, Laplace, and Philosophies of Probability (1764, 1774) 109
Problem 15. Leibniz’s Error (1768) 132
Problem 16. The Buffon Needle Problem (1777) 134
Problem 17. Bertrand’s Ballot Problem (1887) 143
Problem 18. Bertrand’s Strange Three Boxes (1889) 147
Problem 19. Bertrand’s Chords (1889) 151
Problem 20. Three Coins and a Puzzle from Galton (1894) 156
Problem 21. Lewis Carroll’s Pillow Problem No. 72 (1894) 157
Problem 22. Borel and A Different Kind of Normality (1909) 161
Problem 23. Borel’s Paradox and Kolmogorov’s Axioms (1909, 1933) 165
Problem 24. Of Borel, Monkeys, and the New Creationism (1913) 173
Problem 25. Kraitchik’s Neckties and Newcomb’s Problem (1930, 1960)
Problem 26. Fisher and the lady Tasting Tea (1935) 188
Problem 27. Benford and the Peculiar Behavior of the First Significant Digit (1938) 195
Problem 28. Coinciding Birthdays (1939) 200
Problem 29. Lévy and the Arc Sine Law (1939) 206
Problem 30. Simpson’s Paradox (1951) 210
Problem 31. Gamow, Stern, and Elevators (1958) 215
Problem 32. Monty-Hall, Cars, and Goats (1975) 218
Problem 33. Parrondo’s Perplexing Paradox (1996) 224
Bibliography 230
Photo Credits 254

quinta-feira, 28 de junho de 2012

Geometric Exercises in Paper Folding


Sundara T. Row 

Chicago, The Open Court pub. co | 1917

online: archive.org

online: chestofbooks.com (html)

PDF - 13 Mb

arvindguptatoys.com (link direto)

djvu - 2,7 Mb

The idea of this book was suggested to me by Kindergarten Gift No. VIII. - Paper-folding. The gift consists of two hundred variously colored squares of paper, a folder, and diagrams and instructions for folding. The paper is colored and glazed on one side. The paper may, however, be of self-color, alike on both sides. In fact, any paper of moderate thickness will answer the purpose, but colored paper shows the creases better, and is more attractive. The kindergarten gift is sold by any dealers in school supplies ; but colored paper of both sorts can be had from stationery dealers. Any sheet of paper can be cut into a square as explained in the opening articles of this book, but it is neat and convenient to have the squares ready cut.

quarta-feira, 27 de junho de 2012

The Contest Problem Book V: American High School Mathematics Examinations (AHSME) / American Invitational Mathematics Examinations (AIME) 1983-1988


George Berzsenyi,  Stephen B. Maurer 

The Mathematical Association of America | 1997 | 308 páginas | PDF | 7,41 Mb

link

Berzsenyi and Maurer raised the level of The Contest Problem Book series to new highs by including A guide to the Problem Literature, dropped problems of AHSME and AIME and a thematic index of the problems. Their book is a valuable addition to personal libraries of all enthusiasts of problem solving in general and mathematics competitions in particular. —Zentrallblatt für Mathematik
We are all in the debt of the authors...not only for their role in unearthing some of the gems, but also for polishing and mounting them so attractively. —The Mathematical Gazette
...it is a great resource for mathematics teachers because it furnishes the complete exams and detailed solutions. The solutions are very useful because many of the questions are quite challenging ... Mathematics teachers and students at both high school and college levels will find this collection a useful resource and a welcome addition to the ongoing series. Also of great use to teachers are the indexed classification of problems by type and the excellent bibliography of problem-solving resources. General readers; lower-division undergraduates; faculty. —CHOICE
Over the years perhaps the most popular of the MAA problem books have been the high school contest books, covering the yearly American High Mathematics Examinations (AHSME) that began in 1950, co-sponsored from the start by the MAA. Book V also includes the first six years of the American Invitational Mathematics Examination (AIME) which was developed as an intermediate step between the AHSME and the USA Mathematical Olympiad (USAMO). The AIME has a unique answer format—all answers are integers between 0 and 999.
The editors of this volume, George Berzsenyi and Stephen B. Maurer, were respectively the chair of the AIME and the AHSME during this period. In addition to a thorough index, they have added much material not included in Contest Books I–IV:
  • a comprehensive guide to other problem materials world wide
  • additional solutions,
  • dropped problems,
  • statistical information
  • information on test development and history
This is a must volume for avid fans of elementary problems, young and old.

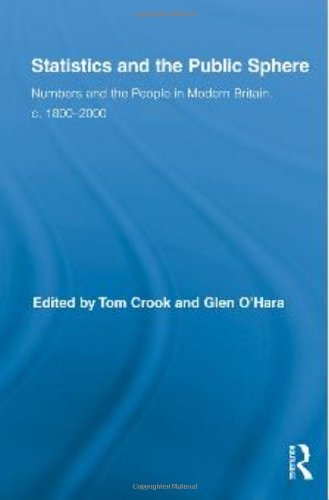
Statistics and the Public Sphere: Numbers and the People in Modern Britain, c. 1800-2000


(Routledge Studies in Modern British History)

Tom Crook, Glen O'Hara 

Routledge | 2011 | 290 páginas | rar - PDF | 2,2 Mb

link (password: matav)

Contemporary public life in Britain would be unthinkable without the use of statistics and statistical reasoning. Numbers dominate political discussion, facilitating debate while also attracting criticism on the grounds of their veracity and utility. However, the historical role and place of statistics within Britain’s public sphere has yet to receive the attention it deserves. There exist numerous histories of both modern statistical reasoning and the modern public sphere; but to date, there are no works which, quite pointedly, aim to analyse the historical entanglement of the two. Statistics and the Public Sphere: Numbers and the People in Modern Britain, c.1800-2000 directly addresses this neglected area of historiography, and in so doing places the present in some much needed historical perspective.

terça-feira, 26 de junho de 2012

Quantifying the User Experience: Practical Statistics for User Research


Jeff Sauro, James R Lewis

Morgan Kaufmann | 2012 | 312 páginas | PDF | 5,2  Mb

link

You're being asked to quantify usability improvements with statistics. But even with a background in statistics, you are hesitant to statistically analyze the data, as you may be unsure about which statistical tests to use and have trouble defending the use of the small test sample sizes associated with usability studies.
The book is about providing a practical guide on how to use statistics to solve common quantitative problems arising in user research. It addresses common questions you face every day such as: Is the current product more usable than our competition? Can we be sure at least 70% of users can complete the task on the 1st attempt? How long will it take users to purchase products on the website? This book shows you which test to use, and how provide a foundation for both the statistical theory and best practices in applying them. The authors draw on decades of statistical literature from Human Factors, Industrial Engineering and Psychology, as well as their own published research to provide the best solutions. They provide both concrete solutions (excel formula, links to their own web-calculators) along with an engaging discussion about the statistical reasons for why the tests work, and how to effectively communicate the results.
    *Provides practical guidance on solving usability testing problems with statistics for any project, including those using Six Sigma practices
      *Show practitioners which test to use, why they work, best practices in application, along with easy-to-use excel formulas and web-calculators for analyzing data
        *Recommends ways for practitioners to communicate results to stakeholders in plain English

        Navigating through Data Analysis and Probability in Prekindergarten-Grade 2


        Linda Jensen Sheffield, Mary Cavanagh, Linda Dacey, Carol R. Findell, Carole Greenes, and Marian Small

        National Council of Teachers of Mathematics |  2002  | 100 páginas | PDF | 2,9 Mb

        Nenhum link disponível

        O livro não está completo, as páginas em falta estão referenciadas em baixo, no índice

        This book demonstrates how some fundamental ideas about data analysis and probability can be introduced to build a strong foundation in young students. Activities designed to introduce and promote familiarity with essential concepts develop and extend students' ideas about data analysis and simple probability through the use of bar graphs, tallies, frequency tables, and Venn diagrams. Helpful margin notes provide teaching tips, anticipated student responses to questions, samples of students' work, and ways to modify the activities for students experiencing difficulty or needing enrichment. The supplemental CD-ROM features interactive electronic activities, master copies of activity pages for students, and additional readings for teachers.

        Índice

        Table of Contents
        About This Book  . vii
        Introduction . 1 (falta)
        Chapter 1 - Data Collection, Organization, and Display . 11
        Build a Graph . 15
        What’s Your Favorite?  . 18
        Junk Sort  . 22
        All about Shoes  . 25
        Chain It . 27
        Families. 30
        Row Your Boat  . 33
        Morley Most and Lutie Least  . 36
        Chapter 2 - Question Posing and Data Analysis .  41 (falta)
        Back and Forth . 44 (falta)
        Mystery Graphs . 50
        Conducting a Survey . 53 (falta)
        What a Difference a Day Makes . 55
        Whom Do You Believe? . 58
        Travel Agent . 61 (falta)
        Chapter 3 - Probability . 63 (falta)
        Possible or Impossible . 65
        Spin It . 67
        Which Bag Is Which?  . 70
        Some Sums . 73 (falta)
        Looking Back and Looking Ahead . 77 (falta)
        Appendix - Blackline Masters and Solutions  . 79 (falta)
        Vertical Graph Mat . 80
        Horizontal Graph Mat . 81
        Mary Had a Little Lamb . 82
        Mystery Graphs . 83
        Which Is Which? . 84
        More than One Story. 85
        Our Survey . 86
        About Students . 87
        More about Students  . 88
        Favorite Colors  . 89
        Children in a Class . 90
        Class Trip . 91 (falta)
        Spin It  . 93
        Color Predictions  . 95
        Color Splits  . 96
        Solutions  . 97 (falta)
        References  . 98 (falta)

        Introduction
        Table of Standards and Expectations, Data Analysis and Probability, Pre-K–12 (faltam)
        Applet Activities
        Get Organized
        Shape Sorter
        Guess the Rule
        Make the Rule
        Probability Games
        Preset Spinner
        Make Your Own Spinner
        Dice Sums
        Blackline Masters and Templates (faltam)
        Blackline Masters
        Ages of Students
        Number of Students’ Pets
        Number of Students’ Siblings
        Students’ Favorite Sport
        One-Half-Inch Grid Paper
        One-Inch Grid Paper
        Two-Centimeter Grid Paper

        Readings from Publications of the National Council of Teachers of Mathematics
        Collecting Data Outdoors: Making Connections to the Real World
        Carole Basile
        Teaching Children Mathematics

        Describes a process of data collection with young children using the outdoors as a mathematical context. The process of data collection and processing introduces children to more abstract mathematics as they sort and classify data, create graphs, compare datasets, examine patterns, and interpret graphical representations.

         
        Exploring Data: Kindergarten Children Do It Their Way
        Frances R. Curcio e Susan Folkson
        Teaching Children Mathematics

        Describes situations in which children developed mathematical concepts through processes of sorting and classifying, comparing, measuring, matching with one-to-one correspondence, and enumerating. Data were gathered while observing informal discourse, during sharing sessions, and in a reading session.
        Young Students Investigate Number Cubes
        Alex Friedlander
        Teaching Children Mathematics

        Describes a series of learning activities built around number cubes. Sample activities introduce elementary properties of the cube, the magic rule of seven, and basic concepts related to graphs in the plane coordinate system.

        Making Sense of Graphs: Critical Factors Influencing Comprehension and Instructional Implications
        Susan N. Friel, Frances R. Curcio, e George W. Bright
        Journal for Research in Mathematics Education

        This article outlines critical factors that appear to influence graph comprehension and identifies instructional implications. The factors identified are purpose, task characteristics, discipline characteristics and reader characteristics. A sequence for ordering the introduction of graphs is proposed and ways instruction may be modified to promote graph sense making.


        Pictures, Tables, Graphs, and Questions: Statistical Processes
        Andrew C. Isaacs e Catherine Randall Kelso
        Teaching Children Mathematics

        Outlines an approach to the problem of over- or underquantification for students by teaching science as a process of collecting, organizing, and analyzing data that naturally integrates with mathematics. 
        Students’ Probabilistic Thinking in Instruction 
        Graham A. Jones, Cynthia W. Langrall, Carol A. Thornton, e A. Timothy Mogill
        Journal for Research in Mathematics Education

        Evaluates the thinking of third grade students in relation to an instructional program in probability which was informed by a research-based framework that included a description of students' probabilistic thinking. Reveals that overcoming misconceptions in sample space, applying both part-part and part-whole reasoning, and using invented language to describe probabilities were key patterns in producing growth in probabilistic thinking.

        Hamster Math: Authentic Experiences in Data Collection
        Beth Jorgensen
        Teaching Children Mathematics

        Describes the data collection and interpretation project of primary grade students involving predicting, graphing, estimating, measuring, number problem construction, problem solving, and probability.

        Classification and Logical Reasoning 
        Melfried Olson e Judith Olson
        Teaching Children Mathematics

        These activities explore classification and logical reasoning by providing students with opportunities to generate multiple answers and engage in multiple classifications of the same item. No solutions are suggested so that students will look to themselves as the mathematical authorities. Sample items for classification include birthday months, toys, holidays, and geometric figures. Numbers are classified by skip counting and factoring.

        The Shape of Fairness 
        Elizabeth Penner e Richard Lehrer
        Teaching Children Mathematics

        Describes how young children used geometric shapes to model a fair playing space for "Mother, may I?"

        Take Two: Fair or Unfair? 
        Lynae Sakshaug
        Teaching Children Mathematics

        Problem Solvers poses a problem for classroom use and gives a solution to a previously published problem.

        Responses to the Take Two: Fair or Unfair? Problem
        Lynae Sakshaug
        Teaching Children Mathematics

        Presents answers to the problem appearing in the January, 1999 Problem Solvers section of this journal, which was a strategy game called "Take Two" in which two players played by placing seven chips in a row and removing one or two chips each turn.

        Which Graph Is Which?
        Lynae Sakshaug
        Teaching Children Mathematics

        Introduces a problem that can be used to help children develop graph sense. Involves two graphs of which students must determine which one applies to which situation.

        Young Children Deal with Data 
        Judith V. Taylor
        Teaching Children Mathematics

        Presents activities having to do with data generation, organization, interpretation, representation, drawing conclusions, and making predictions on the basis of data which students have collected. 

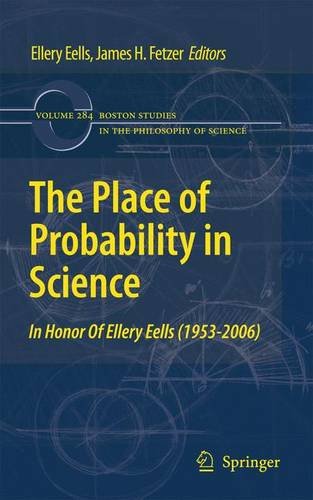
        The Place of Probability in Science: In Honor of Ellery Eells (1953-2006)


        Ellery Eells, J.H. Fetzer

        Springer | 2010| 368 páginas | PDF | 3 Mb


        The purpose of philosophy, broadly conceived, can be described as that of attempting to resolve heretofore unsolved conceptual and theoretical problems, especially those that lie at the foundations of knowledge and values. Given the central role of science in acquiring reliable knowledge, the study of science has become of special importance within philosophy. And within philosophy of science, in turn, no other concept possesses the centrality and importance as does that of probability. To clarify and illuminate the place of probability in science Ellery Eells and James H. Fetzer have brought together some of the most distinguished philosophers from our time.
        After a comprehensive introduction to alternative conceptions of objective probability and the difficulties that they confront, three studies describe the special problems that arise within this context and the comparative merits of different accounts. The second section addresses the nature of lawfulness and of relations between micro- and macro-probabilities, especially with reference to the concept of fitness in evolution. The third section confronts some of the difficulties confronted by causal conceptions of probability, especially within the quantum domain. The fourth extends the discussion to principles of inference and decision. The last chapter relates propensities and frequencies to the framework of inference to the best explanation.

        segunda-feira, 25 de junho de 2012

        Navigating through Data Analysis and Probability in Grades 3–5

        Suzanne Chapin, Alice Koziol, Jennifer MacPherson, e Carol Rezba
        National Council of Teachers of Mathematics | | 120 páginas | PDF | 3,89 Mb

        Nenhum link disponível

        O livro não está completo, as páginas em falta estão referenciadas em baixo, no índice

        Investigations involving data give students opportunities to depict the shape of data sets and use statistical characteristics of the data to describe similarities and differences among related sets. An assortment of discussions, activities, and investigations emphasize the collection and analysis of data and develop the idea of probability as a measure of the likelihood of events that are meaningful and real to students. The accompanying CD-ROM features applets for students to manipulate and resources for teachers' professional development. It also features interactive electronic activities, master copies of activity pages for students, and additional readings for teachers.

        Índice


        Table of Contents
        About This Book . vii
        Introduction . 1 (falta)
        Chapter 1 - From Questions to Method: Beginning the Process . 11 (falta)
        Questions, Please?  . 13
        What’s My Method? . 17
        Chapter 2 - Using Data Analysis Methods . 21 (falta)
        Long Jump  . 23
        How Many Stars Can You Draw in One Minute? . 29
        Do You Get Enough Sleep?. 34
        Exploring the Mean  .39
        Chapter 3 - Inferences and Predictions . 45 (falta)
        The Foot, the Whole Foot, and Nothing but the Foot! . 47
        Can You Catch Up? . .. 51
        Chores—How Many Hours a Week Are Typical? . 56
        Chapter 4 - What Are the Chances? . 61 (falta)
        How Likely Is It to Land in the Trash Can? . 62
        Is There Such a Thing as a Lucky Coin? . 68
        Spin City . 73
        Is It Fair? . 79
        Looking Back and Looking Ahead .83
        Appendix - Blackline Masters and Solutions  . 87 (falta)
        Determining a Purpose for a Data Investigation . 88 (falta)
        Getting Ready . 92
        A Question to Investigate  . 94
        Data Sets . 96
        What’s My Method?—Descriptions  .98
        What’s My Method?—Explorations .100
        Summer Olympics 2000 . 101
        How Long Is One Minute?  . 102
        How Many Stars?—Another Class . 103
        How Much Sleep Do You Get? . 104
        How Much Sleep Do Children Typically Get? . 105
        Women’s Soccer Results  . 106
        The Foot, the Whole Foot, and Nothing but the Foot—Group Data  . 108
        The Foot, the Whole Foot, and Nothing but the Foot—Class Data . 109
        Can You Catch Up?. 110
        Chores—How Many Hours a Week Are Typical? . 111
        Stem-and-Leaf Plot of the Group’s Sample Data  . 112
        Sample versus Population—How Do They Compare? . 113
        Paper Toss Recording Sheet . 114
        Spin It . 115
        Matching Line Plots with Spinners . 116

        Number Cards . 117
        Rule Cards  . 118
        Answer Key for Women’s Soccer Results . 119 (falta)
        References . 120 (falta)

        Contents of CD-ROM
        Introduction
        Table of Standards and Expectations, Data Analysis and Probability,
        Pre-K–12
        Applet Activities (falta)
          Probability Games
          Preset Spinner (on-line: illuminations.nctm)
          Make Your Own Spinner (on-line: illuminations.nctm)
          Dice Sums
          Coin Toss 

        Blackline Masters and Templates

        Readings from Publications of the National Council of Teachers of Mathematics


        Problem Solving: Dealing with Data in the Elementary School
        Harry Bohan, Beverly Irby, and Dolly Vogel
        Teaching Children Mathematics

        Describes the Elementary Mathematics Research Model, which furnishes a vehicle for problem solving through real data collection and analysis.

        Using Probability Experiments to Foster Discourse
        Thomas G. Edwards and Sarah M. Hensien
        Teaching Children Mathematics

        Describes how three experiments suitable for upper-elementary students can be used to foster classroom discourse in which students begin to explore probability.

        Making Charts: Do Your Students Really Understand the Data?
        Louis Feicht
        Mathematics Teaching in the Middle School

        Presents an activity in which students learn how to label graphs in order to make them meaningful.

        Teaching Statistics: What’s Average?
        Susan N. Friel
        The Teaching and Learning of Algorithms in School Mathematics

        Daily Activities for Data Analysis
        Chris Hitch and Georganna Armstrong
        Arithmetic Teacher

        Presents four sets of activities to develop the concepts of data analysis and graphing. Students estimate sample populations using beans, examine graphs from newspapers and magazines, predict the most popular color of cars, and simulate quality control in a manufacturing process.

        Understanding Students’ Probabilistic Reasoning  (falta)
        Graham A. Jones, Carol A. Thornton, Cynthia W. Langrall, and James E. Tarr
        Developing Mathematical Reasoning in Grades K–12

        The Lunch-Wheel Spin
        Julia A. Mason and Graham A. Jones
        Arithmetic Teacher

        Describes a problem formulated by fourth-grade students about having more pizza for lunch, and the clarifying, predicting, modeling, simulating, comparing, and extending activities that occurred in addressing the problem from a probabilistic perspective.

        Children’s Concepts of Average and Representativeness
        Jan Mokros and Susan J. Russell
        Journal for Research in Mathematics Education

        Interviews with (n=21) fourth, sixth, and eighth graders, who were asked to construct their own notion of average and representativeness in open-ended problems, identified five basic constructions of average as mode, an algorithmic procedure, what is reasonable, midpoint, and a mathematical point of balance. 

        Teaching Mathematics with Technology: Statistics and Graphing
        Janet Parker and Connie C. Widner
        Arithmetic Teacher

        Presents a series of four steps used in data analysis processes that help students investigate and interpret real world situations. Gives activities that employ computer software to create representative graphs of the data in the analysis process.

        What Do Children Understand about Average?
        Susan J. Russell and Jan Mokros
        Teaching Children Mathematics

        Interviews with fourth, fifth, and sixth graders found that they thought about the concept of average as mode, median, and/or a procedure. Presents approaches to develop the concept of average

        Exploring Probability through an Evens-Odds Dice Game
        Lynda R. Wiest and Robert J. Quinn
        Mathematics Teaching in the Middle School

        Presents a dice game that students can use as a basis for exploring mathematical probabilities and making decisions while they also exercise skills in multiplication, pattern identification, proportional thinking, and communication. 

        Mean and Median: Are They Really So Easy?
        Judith S. Zawojewski and J. Michael Shaughnessy
        Teaching Mathematics in the Middle School

        Analyzes National Assessment of Education Progress (NAEP) items to assess student understanding of spread as well as center, such as mean and median. Discusses implications for teaching statistics in 5th and 6th grade mathematics.

        Collecting, counting and measuring - developing number sense


        Investigations in number, data, and space

        Megan Murray, Karen Economopoulos, Marlene Kliman

        Dale Seymour Publications | 1998 | 168 páginas | PDF | 13,4 Mb

        Ano de escolaridade: Pré-escolar

        Nenhum link disponível

        Students will explore numbers and number relationships through a variety of counting experiences.  They will count sets of classroom materials. They will make counting books, and count and compare the number of letters in their names.  They play mathematical games and solve mathematical problems that involve counting and accumulating amounts.  With repeated opportunities to count in real ways, students build their knowledge of the counting sequence and of the quantities those numbers represent.  Through the unit students begin to explore ways to use pictures, numerals, objects, and words to represent the quantities they count.  In addition to their work with counting, students explore the concept of measurement as they directly compare the lengths of objects to find out which is longer. 

        Investigation 1:  Counting Books   Students will:   think about what, when, and why people count; recognize numerals and number names; connect numerals to the quantities they represent; create a set of a given size; develop strategies for counting and keeping track of quantities; and represent quantititew with pictures, numerals, or words.
        Investigation 2:  Taking Inventory
           Students will:  connect numerals to the quantities they represent;  develop strategies for counting and keeping track of quantities;  create a set of a given size; and represent quantities with pictures, numerals, or words.
        Investigation 3:  Comparing Towers
          Students will:  develop and use language to describe and compare lengths;  measure by direct comparison;  develop strategies for counting and keeping track of quantities; represent quantities with objects, pictures, numerals, or words.
        Investigation 4:  Counting and Comparing
           Students will:  count groups of objects;  create a set of a given size; compare quantities to determine which is more; use terms to describe and compare amounts; keep track of the size of a growing collection; find the total of two single-digit numbers; and record mathematical work.
        Investigation 5:  Least to Most
           Students will:  count sets of objects; compare quantities to determine which is more; use appropriate language to describe and  compare amounts; order quantities from leat to most or most to least; represent mathematical work.
        Investigation 6:  Arrangements of Six
           Students will:  find ways to visualize and arrange a set of six objects; solve a problem with many possible solutions; develop strategies for counting and keeping track of quantities through about 12; represent quantities with objects, pictures, or numerals, compare quantities to determine which is more; use language to describe and compare amounts; and order from least to most.


        domingo, 24 de junho de 2012

        Sorting: Groups and Graphs. Used Numbers. Grades 2-3

        Rebecca B. Corwin e Susan Jo Russell

        Dale Seymour Publications | 1990 | 132 páginas | PDF | 3,2 Mb

        Nenhum link disponível

        A unit of study that introduces sorting and classification as a way of organizing data is presented. Suitable for students in grades 2 and 3, it provides a foundation for further work in statistics and data analysis. The investigations may extend from one to five class sessions and are grouped into three parts: "Introduction to Sorting"; "Sorting and Classifying Data"; and "Projects in Data Analysis." An overview of the investigation, session activities, dialogue boxes, and teacher notes are included in each investigation. The major goals developed in each part of this guide are: (1) examining differences and similarities of objects or data; (2) decision making; (3) using negative information to clarify the definition of a category; (4) making sketches of data; (5) thinking flexibly about the characteristics of data; (6) articulating logical reasoning; (7) constructing categories to describe data; (8) inventing representations of data; (9) building theories about data; (10) collecting and recording survey data; (11) comparing two data sets; and (12) experiencing the phases of a data analysis investigation. Appended are reproducible student materials, including two sets of cards for developing sorting skills.

        Measuring: From Paces to Feet. Used Numbers: Real Data in the Classroom. Grades 3-4


        Rebecca B. Corwin;  Susan Jo Russell

        Addison-Wesley | 1990 | PDF | 2,6 Mb

        Nenhum link disponível

        A unit of study that introduces measuring as a way of collecting data is presented. Suitable for students in grades 3 and 4, it provides a foundation for further work in statistics and data analysis. The investigations may extend from one to four class sessions and are grouped into three parts: "Introduction to Measurement"; "Using Standard Measures"; and "A Project in Data Analysis." An overview of the investigation, session activities, dialogue boxes, and teacher notes are included in each investigation. The major goals developed in each part of this guide are: (1) moving through space and counting the movements; (2) comparing units of measure; (3) estimating distances; (4) defining a measurement method; (5) writing directions involving distances; (6) recording and displaying the results of measurement; (7) experiencing a need to standardize; (8) understanding that standard measures were invented to solve real data collection problems; (9) estimating lengths; (10) measuring accurately, using feet and inches; (11) describing the shape of the data; (12) analyzing data through landmarks and features of the data; (13) using standard measures to compare data sets; and (14) experiencing all the phases of a data analysis investigation in which measuring is used to collect data. Seven student sheets are attached.

        Statistics: The Shape of the Data. Used Numbers: Real Data in the Classroom. Grades 4-6.


        Susan Jo Russell e Rebecca B. Corwin

        Pearson Learning | 1989| 88 páginas | PDF | 2,4 Mb

        Nenhum link disponível

        A unit of study that introduces collecting, representing, describing, and interpreting data is presented. Suitable for students in grades 4 through 6, it provides a foundation for further work in statistics and data analysis. The investigations may extend from one to four class sessions and are grouped into three parts: "Introduction to Data Analysis"; "Learning About Landmarks in the Data"; and "A Project in Data Analysis." An overview of the investigation, session activities, dialogue boxes, and teacher notes are included in each investigation. The major goals developed in each part of this guide are: (1) describing the shape of the data; (2) defining the way data will be collected; (3) summarizing what is typical of the data; (4) making quick sketches of the data; (5) inventing ways to compare two sets of data; (6) representing data first through sketches, then through a presentation graph or chart; (7) using the median as a landmark in the data; (8) understanding that the median is only one landmark in the data; and (9) experiencing all the stages of a data analysis investigation. Attached are 10 student sheets

        sábado, 23 de junho de 2012

        California Math Triumphs: Fractions and Decimals, Volume 2A

        Basich Whintey

        Mcgraw-hill | 2008 | 87 páginas | PDF | 8,97 Mb

        link
        link1

        Site do Manual

        glencoe.mcgraw-hill.com

        California Math Triumphs is an intensive intervention resource for students who are two or more years below grade level. The series provides step-by-step intervention, vocabulary support, and data-driven decision making to help students succeed in high school mathematics.

        Designed to support students needing the most intensive intervention, Math Triumphs: Fractions and Decimals helps build mastery of the foundational skills and concepts from prior grades that are prerequisites to the current grade level. Uniquely scaffolded practice problems provide support by breaking down each skill into the simplest understanding.

        CONTENTS

        Volume 2A - Chapter 1: Parts of a Whole
        Volume 2A - Chapter 2: Equivalence of Fractions

        Masculinities in Mathematics


        (Educating Boys, Learning Gender)

        Heather Mendick

        Open University Press | 2006 | 192 Páginas| PDF | 1,57 Mb

        link
        link1

        "We desperately need more people with good mathematical qualifications to fill many posts in numerate occupations, yet the numbers choosing to continue studying mathematics have fallen over the last 10 years. This book is important as it investigates how mathematics is aligned with masculinity and hence is not attractive to a significant part of the population. It is also challenging, scholarly, and a thoroughly good read. It reports the results of carefully designed research on gender and choice, and includes some fascinating individual case-studies. It should make us all reflect on what we are doing and how we can repair the damage." Margaret Brown, Professor of Mathematical Education, King's College London

        "The book speaks to me as one of those texts that will become seminal in mathematics education. It is original, refreshing, and despite a complicated plot, points to some ways forward. It is engagingly written, if at times perhaps a little bit no-nonsense in tone. It will be of interest to teachers and teacher educators, as well as providing a theoretical stance that should inform future research." British Educational Research Journal

        The study of mathematics, together with other 'gendered' subjects such as science and engineering, usually attracts more male than female pupils, particularly at more advanced levels. In this book Heather Mendick explores this phenomenon, addressing the important question of why more boys than girls choose to study mathematics. She combines new research with an original theoretical approach to argue that 'doing mathematics is doing masculinity'. The book illuminates what studying mathematics means for both students and teachers and offers a broad range of insights into students' views and practices. In addition to the words of young people learning mathematics, the masculinity of mathematics is explored through historical material and cinematic representations. Heather Mendick discusses the ways in which the alignment of mathematics with masculinity creates tensions for girls and women doing the subject. These tensions are sensitively explored through interviews with young men and women, to show how doing mathematics fits or conflicts with their gender identities. Finally, the book explores the implications for teachers, including ways to promote gender equity in mathematics education. This is key reading for students on courses in gender and education, mathematics education, gender and curriculum, and social justice.

        This book illuminates what studying mathematics means for both students and teachers and offers a broad range of insights into students' views and practices. In addition to the words of young people learning mathematics, the masculinity of mathematics is explored through historical material and cinematic representations. The author discusses the ways in which the alignment of mathematics with masculinity creates tensions for girls and women doing the subject. These tensions are sensitively explored through interviews with young men and women, to show how doing mathematics fits or conflicts with their gender identities. Finally, the book explores the implications for teachers, including ways to promote gender equity in mathematics education. Following an introduction, this book is divided into three parts. Part 1, Scene Setting, presents the first chapters of the book: (1) Engendering Mathematics; and (2) Introducing the Study. Part 2, Sex by Numbers, continues with chapters: (3) Being/Doing "Good at Maths"; (4) Proving Something to Others; (5) Proving Something to Themselves; and (6) Changing Directions. Finally, Part 3, Queering Gender and Maths, concludes the book with the remaining chapters: (7) Making Choices Social: Refusing Essences in the Classroom; (8) Supporting Gender Transgression: Being and Acting Different in Maths; and (9) Opening Up Mathematics: Living with Uncertainty.

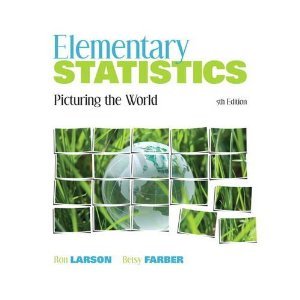
        Elementary Statistics: Picturing the World

        Ron Larson
        5.ª Edição

        Addison Wesley | 2012 | PDF | 786 páginas | 12,8 Mb


        Elementary Statistics: Picturing the World, Fifth Edition, offers our most accessible approach to statistics–more than 750 graphical displays that illustrate data, readers are able to visualize key statistical concepts immediately. Adhering to the philosophy that students learn best by doing, this book relies heavily on examples–25% of the examples and exercises are new for this edition. Larson and Farber continue to demonstrate that statistics is all around us and that it’s easy to understand.

        Table of Contents

        Part One. Descriptive Statistics

        1. Introduction to Statistics
        1.1. An Overview of Statistics
        1.2. Data Classification
        1.3. Data Collection and Experimental Design

        2. Descriptive Statistics
        2.1. Frequency Distributions and Their Graphs
        2.2. More Graphs and Displays
        2.3. Measures of Central Tendency
        2.4. Measures of Variation
        2.5. Measures of Position

        Part Two. Probability & Probability Distributions

        3. Probability
        3.1. Basic Concepts of Probability and Counting
        3.2. Conditional Probability and the Multiplication Rule
        3.3. The Addition Rule
        3.4. Additional Topics in Probability and Counting

        4. Discrete Probability Distributions
        4.1. Probability Distributions
        4.2. Binomial Distributions
        4.3. More Discrete Probability Distributions

        5. Normal Probability Distributions
        5.1. Introduction to Normal Distributions and the Standard Normal Distribution
        5.2. Normal Distributions: Finding Probabilities
        5.3. Normal Distributions: Finding Values
        5.4. Sampling Distributions and the Central Limit Theorem
        5.5. Normal Approximations to Binomial Distributions

        Part Three. Statistical Inference

        6. Confidence Intervals
        6.1. Confidence Intervals for the Mean (Large Samples)
        6.2. Confidence Intervals for the Mean (Small Samples)
        6.3. Confidence Intervals for Population Proportions
        6.4. Confidence Intervals for Variance and Standard Deviation

        7. Hypothesis Testing with One Sample
        7.1. Introduction to Hypothesis Testing
        7.2. Hypothesis Testing for the Mean (Large Samples)
        7.3. Hypothesis Testing for the Mean (Small Samples)
        7.4. Hypothesis Testing for Proportions
        7.5. Hypothesis Testing for Variance and Standard Deviation

        8. Hypothesis Testing with Two Samples
        8.1. Testing the Difference Between Means (Large Independent Samples)
        8.2. Testing the Difference Between Means (Small Independent Samples)
        8.3. Testing the Difference Between Means (Dependent Samples)
        8.4. Testing the Difference Between Proportions

        Part Four. More Statistical Inference

        9. Correlation and Regression
        9.1 Correlation
        9.2. Linear Regression
        9.3. Measures of Regression and Prediction Intervals
        9.4. Multiple Regression

        10. Chi-Square Tests and the F-Distribution
        10.1. Goodness-of-Fit Test
        10.2. Independence
        10.3. Comparing Two Variances
        10.4. Analysis of Variance

        11. Nonparametric Tests
        11.1. The Sign Test
        11.2. The Wilcoxon Tests
        11.3. The Kruskal-Wallis Test
        11.4. Rank Correlation
        11.5. The Runs Test

        Appendix A. Alternative Presentation of the Standard Normal Distribution
                    Standard Normal Distribution Table (0-to-z)
                    Alternative Presentation of the Standard Normal Distribution
        Appendix B. Tables
                    Table 1 Random Numbers
                    Table 2 Binomial Distribution
                    Table 3 Poisson Distribution
                    Table 4 Standard Normal Distribution
                    Table 5 t-Distribution
                    Table 6 Chi-Square Distribution
                    Table 7 F-Distribution
                    Table 8 Critical Values for the Sign Test
                    Table 9 Critical Values for the Wilcoxon Signed-Rank Test
                    Table 10 Critical Values for the Spearman Rank Correlation
                    Table 11 Critical Values for the Pearson Correlation Coefficient
                    Table 12 Critical Values for the Number of Runs
        Appendix C. Normal Probability Plots and Their Graphs

        Answers to the Try It Yourself Exercises
        Odd Answers
        Index
        Photo Credits

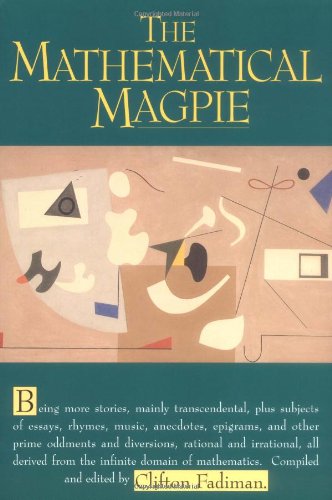
        The Mathematical Magpie


        Clifton Fadiman

        Springer | 1997 | 303 páginas | djvu | 3,9 Mb


        The companion volume to Fantasia Mathematica, first published in 1962, this second anthology of mathematical writings is even more varied and contains stories, cartoons, essays, rhymes, music, anecdotes, aphorisms, and other oddments. Authors include Arthur C. Clarke, Isaac Asimov, Mark Twain, and Lewis Carroll. 19 illus.

        terça-feira, 19 de junho de 2012

        Obstacles épistémologiques relatifs à la notion de limite

        Anka Sierpinska

        Recherches en Didactique des Mathematiques, Vol. 6, n°1, pp. 5-67, 1985

        PDF - 2,4 Mb


        Nenhum link disponível

        Résumé
        La recherche dont il est question dans le présent article se place dans la voie des recherches indiquée par Guy Brousseau dans son article (1983). Découvrir les obstacles épistémologiques lié aux mathématiques à enseigner à l’école et trouver les moyens didactiques pour aider les élèves à les surmonter - voilà, brièvement, deux principaux problèmes de ce programme de recherche. Ici, il s’agit du cas particulier de la notion de limite et l’article ne touche qu’au premier de ces problèmes : on propose une liste d’obstacles épistémologiques relatifs à la notion de limite présents encore chez des élèves d’aujourd’hui ; on ne propose pas les situations didactiques qui permettraient aux élèves de franchir ces obstacles.
        Abstract
        The present paper is concerned with a research the direction of which was indicated by Guy Brousseau in his 1983. To discover the epistemological obstacles connected with mathematics to be taught at school and to.elaborate didactical means to help the students to overcome them- these are, briefly, two main problems of this research programme. In this paper, the particular case of the notion of limit is considered and only the first of the two above mentionned problems is dealt with : a list of epistemological obstacles relative to the notion of limit is proposed ; there are no proposals of didactical situations enabling the students to overcome these.
        Resumen
        La investigación que trata este artículo se situa dentro de la línea de investigaciones indicadas por Guy Brousseau (1983). Descubrir los obstáculos epistemológicos ligados a las matemáticas que se enseñan en la escuela y encontrar los medios didácticos para ayudar los alumnos a superarlos. Brevemente presentamos aqui dos problemas principales de ese programa de investigación. Se trata del caso particular de la noción de limite y el artículo toca solamente el primero de esos problemas : se propone una lista de obstáculos epistemológicos relativos a la noción de límite presentes todavía en los alumnos de hoy en dia ; no se proponen situaciones didácticas que permitirian a los alumnos de superar esos obstáculos.

        Artigo digitalizado por William (Obrigado!)

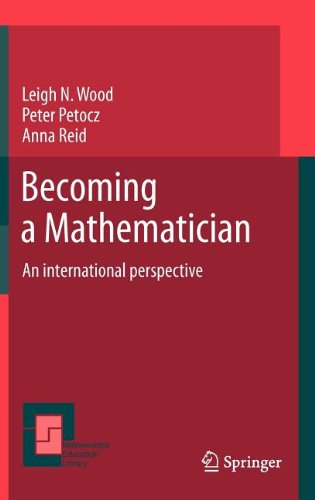
        Becoming a Mathematician: An international perspective


        Leigh Wood, Peter Petocz, Anna Reid

        Springer | 2012 | 196 páginas | PDF | 1,75 Mb

        link
        link1

        • Presents research carried out over a decade in five universities spread over five continents using qualitative and quantitative methods
        • Presents implications for curriculum design and the professional development of mathematics lecturers
        • Investigates learning from the perspective of the learners
        Mathematicians are everywhere and nowhere: although they play key roles in industry and research, business and science, the people who use the ideas and tools of the mathematics are often invisible and difficult to identify. This leads to a lack of clarity for students who are studying the mathematical sciences in their transition to professional life. Becoming a Mathematician considers the process of developing a mathematical identity and becoming a mathematician from the point of view of the participants in the process – students and recent graduates. It focuses on the people who do mathematics rather than on the topics of mathematics. It investigates the development of mathematical scientists for a variety of workplaces, and incorporates the experiences of those who were unsuccessful as well as those who were successful in the transition to the profession. The research presented is based on interviews, observations and surveys of students and graduates as they develop their identity as mathematicians, carried out over a decade in Australia and a diverse range of countries.
        Índice
        Chapter 1: Introduction: How does a person become a mathematician?.- Chapter 2: How do mathematics students think of mathematics? – a first look.- Chapter 3: How do mathematics students go about learning mathematics? – a first look.- Chapter 4: What do mathematics students say about mathematics internationally?.- Chapter 5: How can we track our students’ progress towards becoming mathematicians?.- Chapter 6: What is the contribution of mathematics to graduates’ professional working life?.- Chapter 7: What is the role of communication in mathematics graduates’ transition to professional work?.- Chapter 8: What university curriculum best helps students to become mathematicians?.- Chapter 9: How can professional development contribute to university mathematics teaching?.- Chapter 10: Conclusion: Becoming a mathematician – revisited.- References.- Appendix 1. Short form of conceptions of mathematics survey.- Appendix 2. Mathematical communication outcomes.-Appendix 3. Australian professional development framework.            

        "From Text to 'Lived' Resources: Mathematics Curriculum Materials and Teacher Development


        Ghislaine Gueudet, Birgit Pepin, Luc Trouche

        Springer | 2011 | 369 páginas | PDF | 10 Mb

        link

        • The book addresses both secondary and primary teachers and curricula
        • Draws from research in several countries, and authors with diverse expertise
        • Connects the design of curricula and the use of curricula by teachers
        Curriculum materials and the interaction with these materials and resources is central in teacher education and professional development. How teachers use and learn from materials fundamentally depends on the interactions between three components: the reader, the material and the context. Teachers’ use and learning from text-based materials depends to a large extent on the characteristics of the materials, on the teaching activity in which the teacher is engaged, teachers’ beliefs and knowledge, and how these are aligned with the curriculum. What kinds of curriculum materials do teachers select and use, and how? How do teachers learn from these materials, and in which ways do they ‘tailor’ them for their use and pupil learning? These factors interact in complex ways, as teachers select, interpret and shape the materials, individually and collaboratively with groups of colleagues. The characteristics of the resources shape the teacher’s activity; analysing these characteristics enlightens the mathematics presented to the students, and more generally the classroom practice and the development of teacher professional knowledge. 
        The purpose of this book is to provide a wider perspective on this issue in the field of mathematics education. It studies curriculum materials and their uses, in addition to investigations of teacher adaptation and use of those materials, and pays particular attention to digital resources. Teacher’s professional activity is studied as a whole, at different moments and in different contexts, in-class and out-of-class, with a variety of agents. The collective dimensions of this activity, the role of a variety of collectives for teachers professional development, constitute a major focus of the work presented here.

        Índice
        Foreword: R. Sträßer, Professor of Mathematics Education, Giessen, Germany.- Introduction:G. Gueudet, B. Pepin & L. Trouche.- Section 1: Teacher resources.- Chap. 1 (J. Adler): Knowledge resources in and for school mathematics teaching.- Chap. 2 (G. Gueudet & L. Trouche): Teachers’ work with resources: documentational geneses and professional geneses.- Chap. 3 (G. Sensevy): Patterns of didactic intentions, thought collective and documentation work.- Chap. 4 (M. A. Mariotti & M. Maracci): Resources for the teacher from a semiotic mediation perspective.- Reaction to section 1: B. Barton, President of ICMI, University of Auckland, New Zealand.- Section 2: Text and Curriculum resources.- Chap. 5 (K. Ruthven): Constituting Digital Tools and Materials as Classroom Resources.- Chap. 6 (J. Remillard): Modes of Engagement: Understanding Teachers’ Transactions with Mathematics Curriculum Resources.- Chap. 7 (B. Pepin): Task analysis as ‘Catalytic Tool’ for feedback and teacher learning: Working with teachers on mathematics curriculum materials.- Chap. 8 (W. Schmidt): The Cumulative Effects of Middle School Tracking: How Content Coverage Varies.- Chap. 9 (C. Proust): Teachers’ writings and students’ writings’: school material in Mesopotamia.- Reaction to section 2: M. Swan, Professor of Mathematics Education, Shell Centre, The University of Nottingham, UK.- Section 3: Use of resources.- Chap. 10 (C. Kieran, D. Tanguay & A. Solares): Researcher-designed resources and their adaptation within classroom teaching practice.- Chap. 11 (D. Forest & A Mercier): Classroom's video data and teaching resources: Some thoughts on teacher education.- Chap. 12 (S. Rezat): Interactions of teachers' and students' use of mathematics textbooks: A study of documentational genesis.- Chap. 13 (M. Trigueros & D. Lozano): Teachers teaching mathematics with Enciclomedia.- Chap. 14 (P. Drijvers): Teachers transforming resources into orchestrations.- Reaction to section 3: L. Radford, Professor of Mathematics Education, Laurentian University in Ontario, Canada.- Section 4: Collaborative use.- Chap. 15 (C. Winsløw): A comparative perspective on teacher collaboration: the cases of lesson study in Japan and of multidisciplinary teaching in Denmark.- Chap. 16 (G. Gueudet & L. Trouche): Communities, documents and professional geneses: interrelated stories.- Chap. 17 (J. Visnovska, P. Cobb & C. Dean): Mathematics teachers as instructional designers: what does it take?.- Reaction to section 4: B. Jaworski, Chair in Mathematics Education, Loughborough University, UK.-Closing reaction: D. Lowenberg Ball, Professor in Education, Dean, School of Education, University of Michigan, USA.- Conclusion: the editors.