5.ª Edição
Addison Wesley | 2012 | PDF | 786 páginas | 12,8 Mb
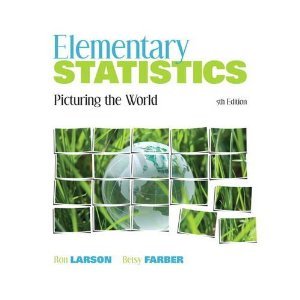
Elementary Statistics: Picturing the World, Fifth Edition, offers our most accessible approach to statistics–more than 750 graphical displays that illustrate data, readers are able to visualize key statistical concepts immediately. Adhering to the philosophy that students learn best by doing, this book relies heavily on examples–25% of the examples and exercises are new for this edition. Larson and Farber continue to demonstrate that statistics is all around us and that it’s easy to understand.
Table of Contents
Part One. Descriptive Statistics
1. Introduction to Statistics
1.1. An Overview of Statistics
1.2. Data Classification
1.3. Data Collection and Experimental Design
2. Descriptive Statistics
2.1. Frequency Distributions and Their Graphs
2.2. More Graphs and Displays
2.3. Measures of Central Tendency
2.4. Measures of Variation
2.5. Measures of Position
Part Two. Probability & Probability Distributions
3. Probability
3.1. Basic Concepts of Probability and Counting
3.2. Conditional Probability and the Multiplication Rule
3.3. The Addition Rule
3.4. Additional Topics in Probability and Counting
4. Discrete Probability Distributions
4.1. Probability Distributions
4.2. Binomial Distributions
4.3. More Discrete Probability Distributions
5. Normal Probability Distributions
5.1. Introduction to Normal Distributions and the Standard Normal Distribution
5.2. Normal Distributions: Finding Probabilities
5.3. Normal Distributions: Finding Values
5.4. Sampling Distributions and the Central Limit Theorem
5.5. Normal Approximations to Binomial Distributions
Part Three. Statistical Inference
6. Confidence Intervals
6.1. Confidence Intervals for the Mean (Large Samples)
6.2. Confidence Intervals for the Mean (Small Samples)
6.3. Confidence Intervals for Population Proportions
6.4. Confidence Intervals for Variance and Standard Deviation
7. Hypothesis Testing with One Sample
7.1. Introduction to Hypothesis Testing
7.2. Hypothesis Testing for the Mean (Large Samples)
7.3. Hypothesis Testing for the Mean (Small Samples)
7.4. Hypothesis Testing for Proportions
7.5. Hypothesis Testing for Variance and Standard Deviation
8. Hypothesis Testing with Two Samples
8.1. Testing the Difference Between Means (Large Independent Samples)
8.2. Testing the Difference Between Means (Small Independent Samples)
8.3. Testing the Difference Between Means (Dependent Samples)
8.4. Testing the Difference Between Proportions
Part Four. More Statistical Inference
9. Correlation and Regression
9.1 Correlation
9.2. Linear Regression
9.3. Measures of Regression and Prediction Intervals
9.4. Multiple Regression
10. Chi-Square Tests and the F-Distribution
10.1. Goodness-of-Fit Test
10.2. Independence
10.3. Comparing Two Variances
10.4. Analysis of Variance
11. Nonparametric Tests
11.1. The Sign Test
11.2. The Wilcoxon Tests
11.3. The Kruskal-Wallis Test
11.4. Rank Correlation
11.5. The Runs Test
Appendix A. Alternative Presentation of the Standard Normal Distribution
Standard Normal Distribution Table (0-to-z)
Alternative Presentation of the Standard Normal Distribution
Appendix B. Tables
Table 1 Random Numbers
Table 2 Binomial Distribution
Table 3 Poisson Distribution
Table 4 Standard Normal Distribution
Table 5 t-Distribution
Table 6 Chi-Square Distribution
Table 7 F-Distribution
Table 8 Critical Values for the Sign Test
Table 9 Critical Values for the Wilcoxon Signed-Rank Test
Table 10 Critical Values for the Spearman Rank Correlation
Table 11 Critical Values for the Pearson Correlation Coefficient
Table 12 Critical Values for the Number of Runs
Appendix C. Normal Probability Plots and Their Graphs
Answers to the Try It Yourself Exercises
Odd Answers
Index
Photo Credits
1. Introduction to Statistics
1.1. An Overview of Statistics
1.2. Data Classification
1.3. Data Collection and Experimental Design
2. Descriptive Statistics
2.1. Frequency Distributions and Their Graphs
2.2. More Graphs and Displays
2.3. Measures of Central Tendency
2.4. Measures of Variation
2.5. Measures of Position
Part Two. Probability & Probability Distributions
3. Probability
3.1. Basic Concepts of Probability and Counting
3.2. Conditional Probability and the Multiplication Rule
3.3. The Addition Rule
3.4. Additional Topics in Probability and Counting
4. Discrete Probability Distributions
4.1. Probability Distributions
4.2. Binomial Distributions
4.3. More Discrete Probability Distributions
5. Normal Probability Distributions
5.1. Introduction to Normal Distributions and the Standard Normal Distribution
5.2. Normal Distributions: Finding Probabilities
5.3. Normal Distributions: Finding Values
5.4. Sampling Distributions and the Central Limit Theorem
5.5. Normal Approximations to Binomial Distributions
Part Three. Statistical Inference
6. Confidence Intervals
6.1. Confidence Intervals for the Mean (Large Samples)
6.2. Confidence Intervals for the Mean (Small Samples)
6.3. Confidence Intervals for Population Proportions
6.4. Confidence Intervals for Variance and Standard Deviation
7. Hypothesis Testing with One Sample
7.1. Introduction to Hypothesis Testing
7.2. Hypothesis Testing for the Mean (Large Samples)
7.3. Hypothesis Testing for the Mean (Small Samples)
7.4. Hypothesis Testing for Proportions
7.5. Hypothesis Testing for Variance and Standard Deviation
8. Hypothesis Testing with Two Samples
8.1. Testing the Difference Between Means (Large Independent Samples)
8.2. Testing the Difference Between Means (Small Independent Samples)
8.3. Testing the Difference Between Means (Dependent Samples)
8.4. Testing the Difference Between Proportions
Part Four. More Statistical Inference
9. Correlation and Regression
9.1 Correlation
9.2. Linear Regression
9.3. Measures of Regression and Prediction Intervals
9.4. Multiple Regression
10. Chi-Square Tests and the F-Distribution
10.1. Goodness-of-Fit Test
10.2. Independence
10.3. Comparing Two Variances
10.4. Analysis of Variance
11. Nonparametric Tests
11.1. The Sign Test
11.2. The Wilcoxon Tests
11.3. The Kruskal-Wallis Test
11.4. Rank Correlation
11.5. The Runs Test
Appendix A. Alternative Presentation of the Standard Normal Distribution
Standard Normal Distribution Table (0-to-z)
Alternative Presentation of the Standard Normal Distribution
Appendix B. Tables
Table 1 Random Numbers
Table 2 Binomial Distribution
Table 3 Poisson Distribution
Table 4 Standard Normal Distribution
Table 5 t-Distribution
Table 6 Chi-Square Distribution
Table 7 F-Distribution
Table 8 Critical Values for the Sign Test
Table 9 Critical Values for the Wilcoxon Signed-Rank Test
Table 10 Critical Values for the Spearman Rank Correlation
Table 11 Critical Values for the Pearson Correlation Coefficient
Table 12 Critical Values for the Number of Runs
Appendix C. Normal Probability Plots and Their Graphs
Answers to the Try It Yourself Exercises
Odd Answers
Index
Photo Credits

Sem comentários:
Enviar um comentário